Choose a consistent period.
Start with a complete month. Compare with the previous month and the same month last year to account for seasonality. Use a comparable baseline for promotions.

Understand what customers spend, measure what matters, and discover opportunities to grow your average order value.
Start with your numbers.
A bigger order is a good start.
A more profitable order is the goal.
Average order value (AOV) is the average amount a customer spends per order in your online store. Calculate it by dividing revenue by the number of orders over the same period.
It helps you understand purchasing behavior, evaluate promotions, and identify opportunities to make each order more valuable.
At the same 300 orders, moving AOV from €80 to €88 generates €2,400 more revenue.
Illustrative example, not a forecast. Track conversion, order volume, and contribution profit alongside AOV.
The calculation is easy. Useful comparisons start with the same definition of revenue and orders.
Start with a complete month. Compare with the previous month and the same month last year to account for seasonality. Use a comparable baseline for promotions.
For merchandise AOV, use product revenue after discounts, excluding tax and shipping. Check your platform’s definition before comparing its dashboard with another source.
Use unique completed orders. Exclude canceled and test orders. Divide by orders, not customers: one shopper can place several orders.
Compare new and returning customers, countries, channels, and promotions. A change in product or customer mix can move AOV without changing individual shopping behavior.
Illustrative example. No returns assumed; tax and shipping excluded.
Try your numbersFor return-adjusted AOV, subtract refunds associated with the original order group and retain those orders in the denominator, including fully refunded orders. State the refund cutoff date. This avoids mixing refunds from earlier purchases with a different month’s orders. Your order export is a useful starting point.
A beauty store and a furniture retailer should not share the same AOV target. Compare similar products, customers, channels, and revenue definitions.
Use these industry figures as context, then identify a specific opportunity in your own store.
| Industry | Relative value | Median AOV |
|---|---|---|
| Apparel & accessories | $99.39 | |
| Beauty | $70.24 | |
| Home & garden | $129.92 | |
| Food & beverage | $71.39 | |
| Sports & outdoors | $131.92 | |
| Health & wellness | $72.34 | |
| Electronics | $127.02 | |
| Pets & animals | $69.08 |
Source: Triple Whale’s Google Ads benchmarks ↗. Report covers more than 21,000 brands, August 1, 2025–July 31, 2026.
These figures come from a Google Ads report, not all ecommerce orders. Category sample sizes, geographic mix, and tax/refund treatment are not specified alongside the source table. Use them as directional context, especially against storewide AOV.
See how different retailers use Clerk to make product discovery more relevant.

Gallerix used Search and Recommendations to help shoppers explore its catalog of prints and frames. The story reports 25% higher AOV and 37% larger baskets.
Read the story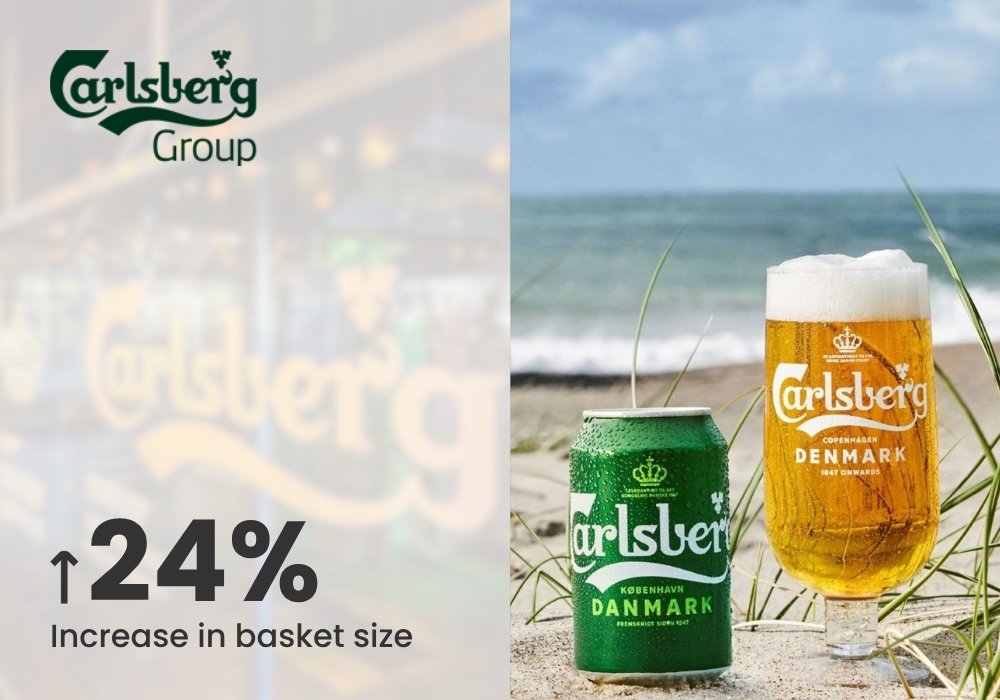
Carlsberg introduced personalized recommendations across its B2B webshop, including product pages and checkout. The story reports 17% higher AOV and 24% larger baskets.
Read the story
Eva Solo combined Search, Recommendations, and Email. Its story reports 125% higher AOV and an 81% increase in basket size, without isolating each tool’s contribution.
Read the storyIndividual reported outcomes, not benchmarks or forecasts. The stories use different implementations and do not provide a standardized test design or measurement window for direct comparison.
The strongest AOV opportunities begin with something useful to the customer. Help them find the right product, understand their options, and discover what goes with it.
A frame for a print. A compatible accessory for a tool. Show useful additions that give shoppers a clear reason to add another product.
Explore RecommendationsExplain what a larger size, longer-lasting version, or extra feature offers. Keep the original option easy to find and make the benefit of the upgrade clear.
Explore product discoveryAfter a shopper adds an item, suggest relevant accessories or products that complete their basket. Explore the Amazon-style upsell page, with a clear route to checkout.
Explore Amazon’s upsell tacticUse your traffic, orders, and average order value to model a potential uplift. Treat the result as a planning scenario, then measure actual performance in your store.
Try the revenue calculatorMore expensive orders can still mean fewer purchases or lower profit. When possible, use randomly assigned test and control groups to track AOV, conversion, revenue per visitor, returns, and contribution profit. A calculator estimate is not a measured result, and higher order values among search users alone do not prove a search change caused an improvement.
No. AOV measures money per order; basket size measures units per order. Three €20 products make a €60 order with a basket size of three. One €100 product creates a higher order value with fewer units.
That depends on the reporting definition. For merchandise analysis, excluding tax and shipping makes product spending easier to compare. Apply the same approach consistently, and check the definition of any external benchmark.
No. Higher prices or order thresholds may increase AOV while reducing purchases. Discounts can encourage bigger orders while cutting profit. Evaluate revenue and contribution profit as well as order value.
Review it monthly for overall performance and more frequently during meaningful tests or promotions. Give returns time to mature before judging return-adjusted results, and avoid conclusions based on only a few orders.
AOV measures the average value of one order. Customer lifetime value considers value across a customer’s relationship with your business. Several modest repeat purchases can be worth more than one large order.
Make relevant products easier to find and useful additions easier to discover with Clerk.